OncBioMune Pharmaceuticals (OTCQB:OBMP) hit an all-time low of 10 cents in the opening days of 2017. In addition to being oversold technically, the markets seemed to have deemed the dime mark a value proposition, with shares climbing as high as 27 cents later in the month and then again in February. What has formed now is what technicians call a “flag pattern,” which means watching to see if resistance at 27 cents can be broken to signal the next leg up for OBMP.
In fairness, other technicians may consider the pattern an ascending triangle. Rather that split hairs over interpretation, the key point is a breakout of 27 cents based upon the last six weeks of trading.
Another important element to consider is that the upward movement this month broke the one-year downtrend line for the chart (neon green line). This dovetails with the idea that flags and triangles, which are often referenced as continuation patterns, can serve a function of reversals as well. The robustness of the pattern and breakout of resistance are of utmost importance in this school of thought.
Below is an image of the flag pattern (pretty easy to see why the pattern is called what it is), along with some areas of support and resistance to take note of.
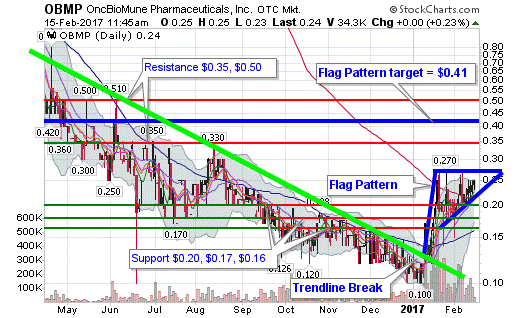
The resistance at $0.27 is clear. On three different occasions this year, OBMP has stalled at that level. From a static perspective, we see more resistance up the road about 30 cents (not drawn), 35 cents and 50 cents.
To the support side, we first note that OBMP has climbed over its 200 day moving average (red line cutting through pattern). This is typically a bullish signal. Currently at 21 cents, the 200 DMA will lend to the static support at 20 cents. We see more support under that at 17 and 16 cents.
Volume has been decreasing since the first run to $0.27, which is typical in a flag pattern (and the formation of many other patterns). A basic tenet of the breakout, should it occur, is a surge in volume as buyers jump in, although it isn’t mandatory to confirm the upside move potential.
The way price targets for a flag pattern are calculated is quite simple. It is a matter of adding the height of the “flagpole” to the breakout point. The height of the flagpole is calculated by subtracting the recent high/resistance from the first resistance break. In the case of OBMP, we’ll use the resistance at $0.27 as the top of the flagpole and $0.13 as the bottom breakout point (where the downtrend and a resistance was broken). That’s a difference of $0.14 for the height of the flagpole.
The flagpole height of $0.14 added to the breakout point of $0.27 generates a technical pattern target of $0.41.
Of course, this all is predicated upon a breakout and the chart not falling through some support levels, which would invalidate the pattern. In it’s current position, though, the pressure looks to be to the upside for OBMP.
 Joins Forces with CoStar Group: A Strategic Analysis for Investors and Traders")
 Secures Alstom Approval: A Game-Changer for Investors and the North American Expansion")
