In last trading session, the stock price of GT Advanced Technologies Inc (OTCMKTS:GTATQ) jumped more than 19% to close the trading session at $0.390. With this the stock has managed to gain more than 60% in just two trading sessions. GT Advanced Technologies has been steadily moving north on the chart since last one month. Currently, the company is functioning in bankruptcy as a debtor in control concentrated on streamlining its operations and debt in charge of its assets.
The measures
GT advanced had obtained financing from bondholders, reduced expenses by 40% and engaged new CEO to achieve its restructuring plans. Back in August, the company reported that it is reducing total headcount and mitigating its operating costs as part of restructuring process. Prior to that, the company obtained a term loan facility worth $95 million from its bond holders. Now, the company is taking necessary measures to streamline its cost structure with new business plan being formulated to enable the company to emerge from bankruptcy in the first quarter next year.
The revised plan
GT Advanced stated that the revised business plan base will be focused on the breadth of its core technologies and products, including company’s ASF(R) sapphire equipment operations, its traditional DSS solar PV and polysilicon business, the marketing of the Merlin cell interconnect know-how and its specialty sapphire materials operations.
In addition to ASF equipment commercialization measures, the company is taking essential initiatives to ensure solar PV products gets completed to capitalize on new increased demand from clients as the solar capital equipment segment witness returned growth in last two years. Also, GT Advanced is looking at its other operations to evaluate their strategic importance to its businesses once it emerges from bankruptcy. The initiatives impact all functions and locations of the company’s worldwide business operations.
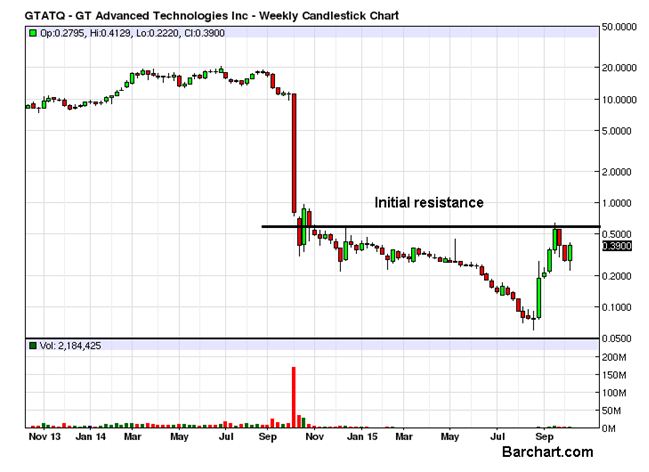
GT Advanced Technologies Inc (OTCMKTS:GTATQ) extended its short term rally with a gain of 19.63% at the end of the last trading session. The volume pattern didn’t look that promising for the second consecutive session as the volume of the day reached only 2.6 million, lower than the daily average of 2.9 million. The area around $0.45-$0.50 can pose some problems for the short term bulls and force a correction before the rally can extend higher. as the chart attached clearly shows, the major supply zone lies around $0.60 and only a firm weekly close above that can aid the bulls.
 justified ?")
 Keep Surging post subcontract news ?")
 Advances in Immuno-Oncology with Recent Offering and Warrant Amendments")